
Assessing Common Method Bias Using Full Collinearity VIF in SmartPLS 4
Full Collinearity VIF is not the Inner VIF table available in the research model. To apply Kock’s proposal correctly, include the scores of all latent variables in the same auxiliary regression and interpret VIF against the 3,3 threshold.
Each latent variable requires a Full Collinearity VIF calculated from all the remaining latent variables. When no value exceeds 3,3, CMB may be described as not a serious concern under this procedure. The results do not prove that the data are entirely free of CMB.
1. What Is Full Collinearity VIF?
Common method bias (CMB) is systematic bias arising from the measurement method rather than the theoretical network of relationships among variables. In self-report surveys, participant instructions, socially desirable responding, item wording, or measuring multiple constructs with the same response format may generate shared variance.
Kock and Lynn (2012) distinguish vertical collinearity among predictors of the same outcome from lateral collinearity between predictor and criterion variables. Full collinearity assessment is designed to diagnose both forms simultaneously. Each latent variable is, in turn, treated as a variable to be explained by all the remaining latent variables.
This is a latent-variable-level diagnostic. It is neither the VIF of individual items nor a p-value, and it does not independently identify the source of a high VIF.
2. Distinguishing Three Types of VIF in SmartPLS
The most common error is to inspect the main model’s Inner VIF table and conclude that CMB has been assessed. That table only assesses collinearity among variables jointly predicting a particular endogenous variable.
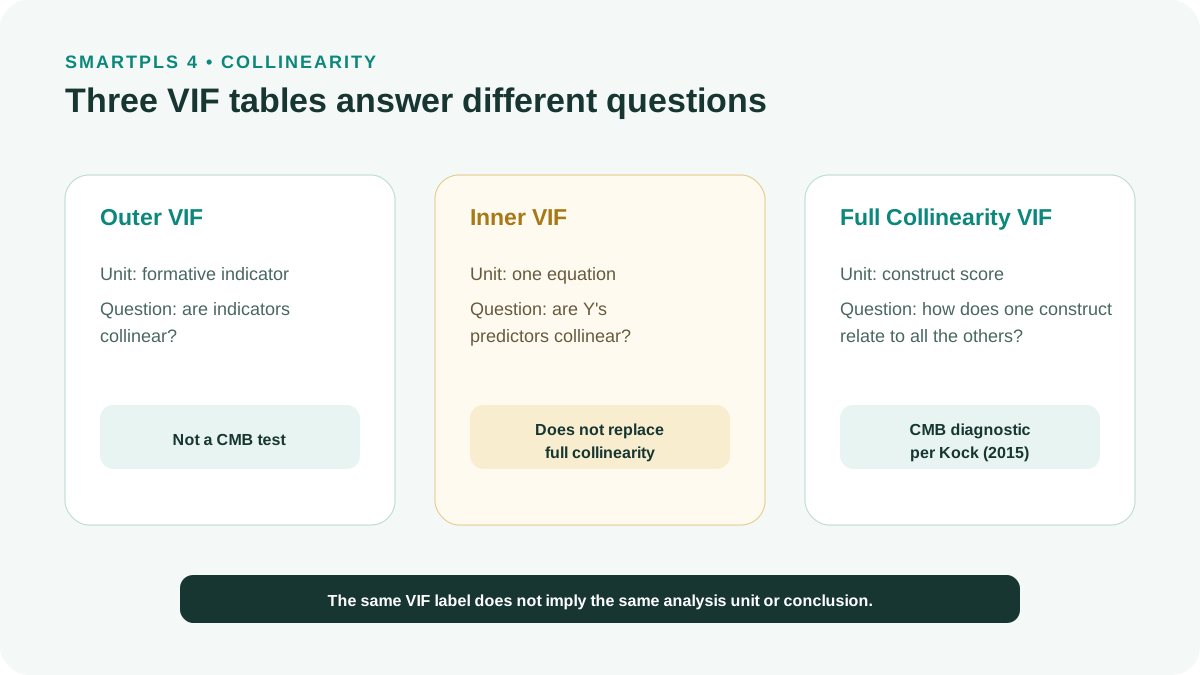
| Index | Assessment unit | Purpose | Assesses CMB according to Kock? |
|---|---|---|---|
| Outer VIF | Formative indicators | Collinearity among indicators forming the same composite | No |
| Inner VIF | Predictors of each endogenous variable | Collinearity within a structural equation | Usually not |
| Full Collinearity VIF | Each latent variable relative to all remaining variables | Diagnoses vertical and lateral collinearity | Yes |
Outer VIF addresses collinearity among formative indicators. Full Collinearity VIF addresses a different question at the latent-variable level.
3. Evidence in Kock (2015) and Limits of Interpretation
Kock (2015) used two simulated datasets, each containing 300 observations, three latent variables, and six indicators per variable. The dataset with added common method variance produced a Full Collinearity VIF of 3,720, exceeding the 3,3 threshold. In contrast, values in the model without CMB ranged from 1,472 to 1,739.
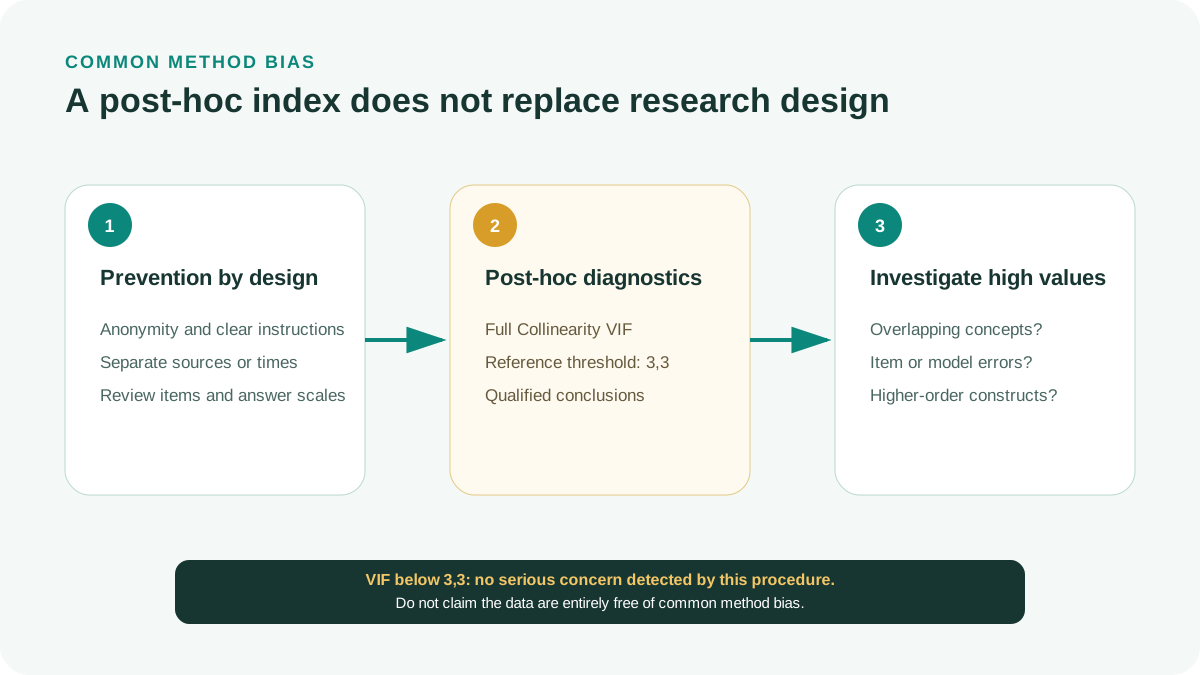
A high VIF does not automatically establish CMB as its cause. Genuine conceptual overlap, poor model specification, or higher-order structures can also increase VIF. This procedure should accompany preventive questionnaire-design measures (Podsakoff et al., 2003, 2012).
4. Workflow in SmartPLS 4
The steps below use score export and regression functions in SmartPLS 4. Command names may vary by version, so consult the current documentation (SmartPLS, n.d.).
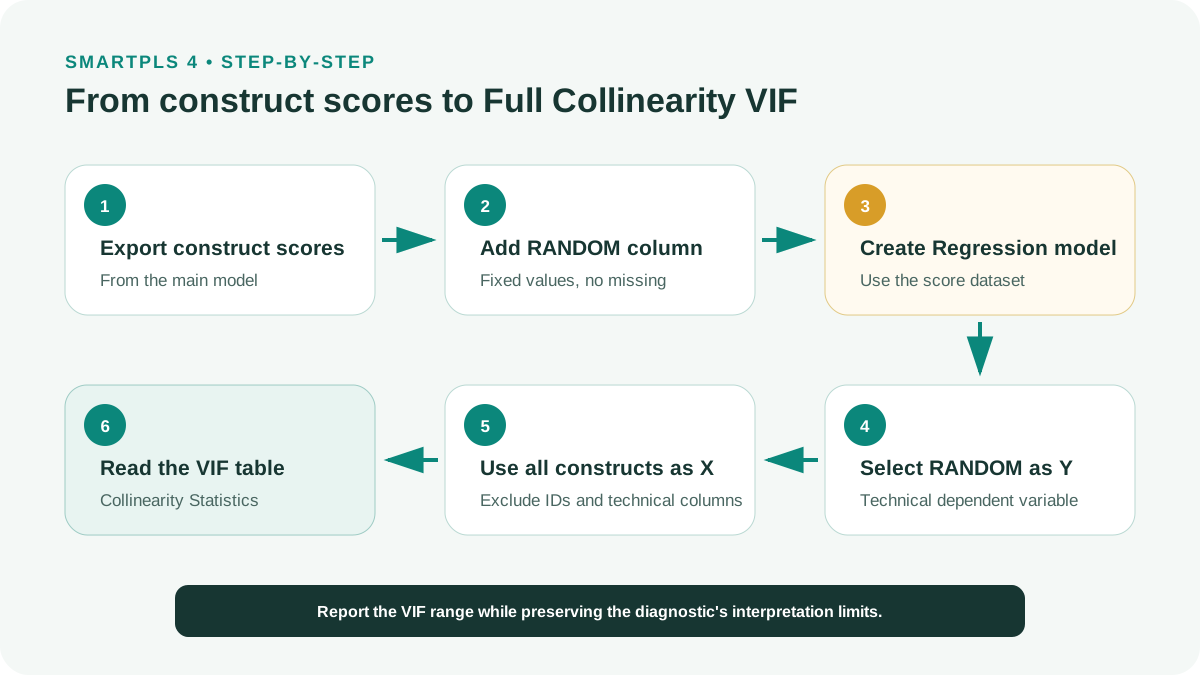
Create a RANDOM column in the data
Add a column of random values, then paste them as values to fix them. The column must have variation and no missing data.
Run the main PLS-SEM model
Import the data, run the PLS-SEM Algorithm, and retain the standardized results. The RANDOM column need not appear in the main research model.
Create a dataset from construct scores
Export latent variable scores from the correct main model. Retain the construct scores, RANDOM column, and observation IDs if needed for cross-checking.
Create a new REGRESSION model
Set RANDOM as the dependent variable. Include all latent variable scores as independent variables in the model.
Run Regression Analysis
Retain the intercept and default settings. Bootstrapping is unnecessary because the objective is to read the original VIFs rather than test regression coefficients.
Read Collinearity Statistics
Record one VIF per latent variable, tabulate the results, and compare them directly with Kock’s (2015) threshold of 3,3.
The VIF of an independent variable is determined by regressing it on the other independent variables. The dependent variable does not appear in the formula. RANDOM merely completes the auxiliary regression and has no theoretical meaning.
5. Reading and Interpreting Results
| Result | Recommended interpretation | Required action |
|---|---|---|
| All VIFs ≤ 3,3 | No indication of serious CMB was detected under this procedure. | Report the range of values and the design remedies applied. |
| Some VIFs > 3,3 | There is evidence of concerning collinearity; CMB is one possible explanation. | Examine conceptual overlap, item content, and model specification. |
| Very high or uncomputable VIF | Near-perfect collinearity or duplicate variables may be present. | Review the data and model before interpretation. |
Example report
Common method bias was assessed using Kock’s (2015) full collinearity procedure. Latent variable scores were entered simultaneously into an auxiliary regression model in SmartPLS 4. Full Collinearity VIF values ranged from [minimum VIF] to [maximum VIF], with none exceeding the threshold of 3,3. These results suggest that CMB is not a serious concern for the relationships analyzed in this study.
6. Common Errors
| Weak practice or wording | Why it is incorrect | Correction |
|---|---|---|
| All Inner VIFs are below 3,3, so CMB is absent. | Inner VIF only considers each set of variables jointly predicting an endogenous variable. | Calculate Full Collinearity VIF using all construct scores. |
| Outer VIF is below 3,3, so the model is unaffected by CMB. | Outer VIF is a formative-indicator-level diagnostic. | Use latent variable scores rather than item VIFs. |
| Include RANDOM in the main model and interpret its paths. | RANDOM has no theoretical role. | Run the auxiliary regression separately and retain only its VIF table. |
| All VIFs below 3,3 prove that the data are entirely free of CMB. | This is an indirect diagnostic that does not identify a specific source of bias. | State that CMB is not a serious concern under the criterion applied. |
7. Prepublication Checklist
- Use the correct construct scores from the PLS-SEM model being reported.
- Ensure that the RANDOM column has variation, contains no missing data, and has fixed values.
- Enter the relevant substantive constructs simultaneously into the same auxiliary regression.
- Exclude IDs, grouping variables, and technical columns from the independent-variable set.
- Do not include a higher-order construct together with all the lower-order components that form it.
- Do not include interaction terms or product indicators in this assessment.
- Read VIFs from Collinearity Statistics rather than the main model’s Outer VIF or Inner VIF.
- Report the minimum-to-maximum VIF range and avoid absolute claims that the data are entirely free of CMB.
Conclusion
Full collinearity assessment is a concise procedure when the logic of VIF is maintained. In SmartPLS 4, the most readily verifiable approach is to use latent variable scores from the main model, place all scores in the same auxiliary regression with a random dependent variable, and interpret VIFs against the 3,3 threshold.
A below-threshold result provides only one piece of post hoc evidence. The research report must still explain the sources of risk, questionnaire design, data-collection process, and limitations of same-source data.
References
Primary methodological sources
- Kock, N. (2015). Common method bias in PLS-SEM: A full collinearity assessment approach. International Journal of e-Collaboration, 11(4), 1–10. https://doi.org/10.4018/ijec.2015100101
- Kock, N., & Lynn, G. S. (2012). Lateral collinearity and misleading results in variance-based SEM: An illustration and recommendations. Journal of the Association for Information Systems, 13(7), 546–580. https://doi.org/10.17705/1jais.00302
- Podsakoff, P. M., MacKenzie, S. B., Lee, J.-Y., & Podsakoff, N. P. (2003). Common method biases in behavioral research: A critical review of the literature and recommended remedies. Journal of Applied Psychology, 88(5), 879–903. https://doi.org/10.1037/0021-9010.88.5.879
- Podsakoff, P. M., MacKenzie, S. B., & Podsakoff, N. P. (2012). Sources of method bias in social science research and recommendations on how to control it. Annual Review of Psychology, 63, 539–569. https://doi.org/10.1146/annurev-psych-120710-100452
SmartPLS 4 documentation
- SmartPLS. (n.d.). Your first regression model. https://www.smartpls.com/documentation/tutorials/first-regression-model/
Academic note: This article explains how to implement Kock’s (2015) procedure in SmartPLS 4. Full Collinearity VIF is a post hoc diagnostic and does not replace design measures intended to reduce common method bias.