
Analyzing Control Variables in SmartPLS 4
SmartPLS makes control paths easy to draw, but the difficult decisions come first: selecting the right variables, coding them properly and identifying which endogenous variables require adjustment.
Enter controls as exogenous variables predicting the relevant endogenous variables. Compare the main relationships between a model without controls and a prespecified controlled model, reporting β, CI, f² and changes in R²; use Gaussian copula only when its assumptions and identification conditions are appropriate (SmartPLS, n.d.).
Controls need justification and sensitivity checks
- Theoretical basis
Explain why adjustment is needed
- Coding
Specify type and reference group
- Specification
Include in the relevant equations
- Sensitivity
Compare adjusted and unadjusted results
Conceptual diagram. Adding more controls does not automatically improve inference.
Source: Lê Minh · Conceptual illustration, not software output.1. Establish the role before drawing paths
Do not add age, gender or income simply because they are available. Each control needs theoretical or design justification and must not unintentionally be a mediator or collider (Bernerth & Aguinis, 2016).
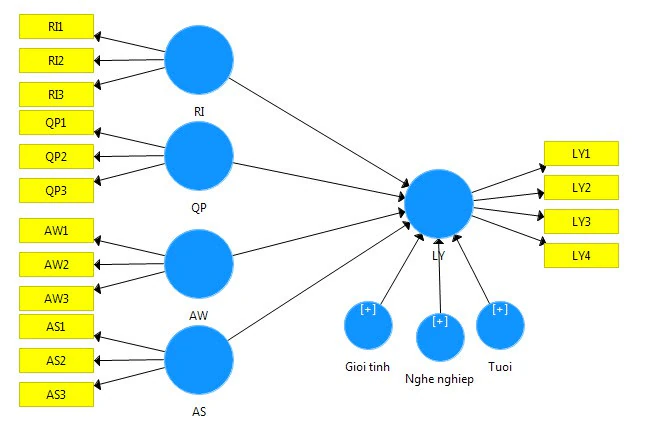
Identify the endogenous variables affected by each control. Do not connect it to every construct unless the causal model requires this.
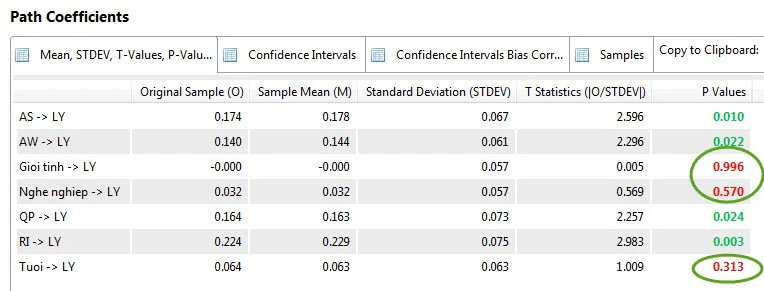
A prespecified control may need to remain despite being nonsignificant. Conversely, a post hoc control with a small p-value is not automatically valid.
2. Code the data
| Type | Coding | Interpretation |
|---|---|---|
| Continuous | Retain the metric; center if a meaningful 0 is needed | Change in Y for a 1-unit increase in the control |
| Binary | 0/1 | Difference between group 1 and group 0 |
| Nominal, k groups | k−1 dummy variables | Each coefficient compares with the reference group |
| Ordinal | Retain ordinal coding or justify an appropriate model | Do not assume equal intervals |
3. SmartPLS workflow
Import control columns
Check the codebook, missingness and reference categories before import.
Create a single-item construct
Assign each observed control to a single-item construct or another appropriate specification.
Draw paths to endogenous variables
Retain the main relationships and connect controls according to the agreed diagram.
Run the PLS-SEM Algorithm
Inspect VIF, β, R² and changes in the main parameters.
Run bootstrapping
Report CIs for controls and the main paths.
4. Interpret results and sensitivity
A control coefficient describes its conditional association with an endogenous variable given the other predictors. f² describes its explanatory contribution; the change in R² describes overall additional explanation but does not prove that confounding has been removed.
Compare M0 without controls and M1 with the prespecified set. If the main coefficient changes sign or changes substantially, explain the estimand and possible confounding.
| Model | Main β | CI | R² | Conclusion |
|---|---|---|---|---|
| M0 without controls | … | […; …] | … | … |
| M1 with controls | … | […; …] | … | … |
5. Reporting template
Reporting example in English
[C] was controlled for because [justification] and coded [ ]. In SmartPLS, C was linked to [Y]. The C → Y coefficient was β = [ ], CI [ ; ], f² = [ ]. The X → Y coefficient changed from [ ] in M0 to [ ] in M1; the conclusion was therefore [stable/changed].
- Justify every control.
- Use 0/1 for binary variables and dummy variables for categories.
- Do not treat controls as interchangeable with moderators.
- Report models with and without controls.
- Do not remove controls only because p is large.
- Do not claim causality merely because controls were added.
Conclusion
Adding controls in SmartPLS is straightforward; validity depends on specification and interpretation. A transparent sensitivity table is more useful than a long list of unjustified controls.
References
- Bernerth, J. B., & Aguinis, H. (2016). A critical review and best-practice recommendations for control variable usage. Personnel Psychology, 69(1), 229–283.https://doi.org/10.1111/peps.12103
- SmartPLS. (n.d.). Gaussian copula approach for endogeneity in PLS-SEM.https://www.smartpls.com/documentation/algorithms-and-techniques/extended-relationships/gaussian-copula/
Methodological note: Controls address only measured factors that are correctly specified. Endogeneity arising from omitted causes, measurement error or simultaneity requires other design and diagnostic approaches.