
A Transparent and Verifiable Workflow for Reporting PLS-SEM
A path-coefficient table is not a complete PLS-SEM report. Readers need the chain of decisions connecting the question, measurement and data with inference, out-of-sample prediction and robustness.
A sound PLS-SEM report follows six evidence layers: method selection, data, specification, measurement, structural assessment, and prediction with robustness. Link each result to settings, its interpretive unit and its limits.
1. Six evidence layers in an assessable report
An assessable PLS-SEM report explains decisions, their justification and how results change under different analytical conditions. A long list of indices cannot compensate for ambiguous specification or undisclosed settings.
Hair et al. (2019) recommend systematic reporting from method justification through measurement and structural assessment. Benitez et al. (2020) emphasize construct type, specification and confirmatory or explanatory objectives. Current practice also requires out-of-sample assessment with PLSpredict and CVPAT (Shmueli et al., 2019; Liengaard et al., 2021).
These six layers organize reporting; they are not six independent acceptance criteria. Favorable prediction does not fix invalid measurement, and acceptable measurement does not establish structural causality.
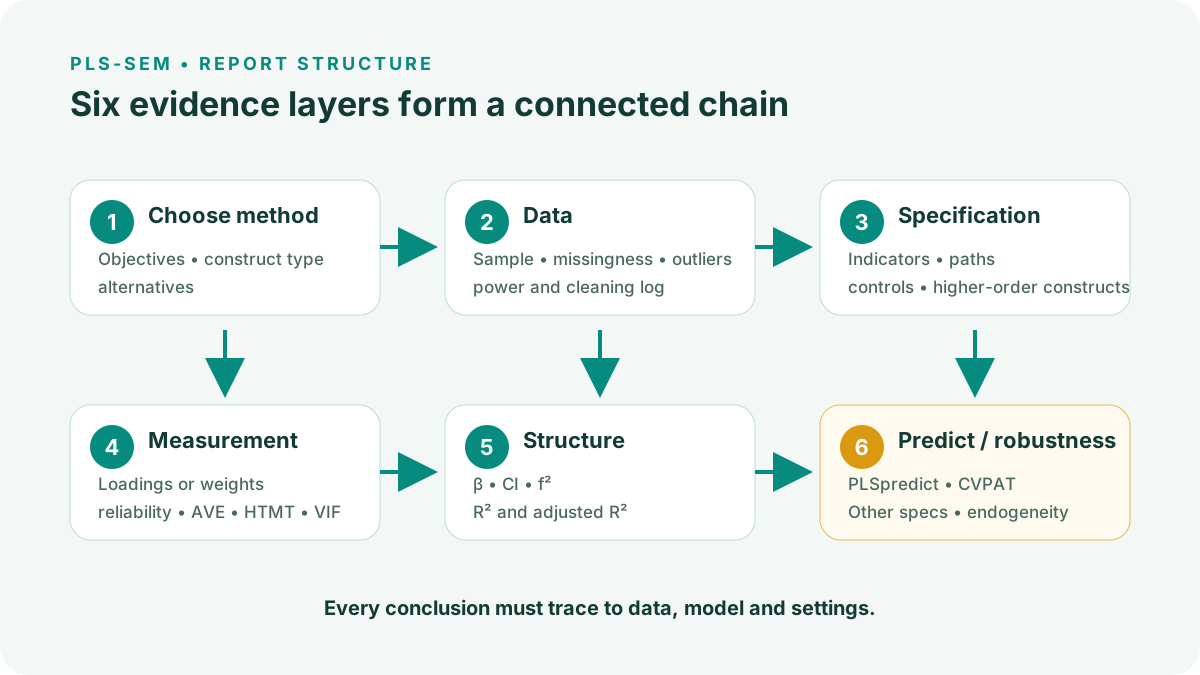
| Layer | Question to answer | Main evidence |
|---|---|---|
| 1. Method selection | Why does PLS-SEM suit the question and construct types? | Objectives, construct types and alternatives |
| 2. Data | How was the sample obtained and cleaned? | Sampling frame, missingness, outliers and power |
| 3. Specification | What theory supports the arrows and indicators? | Diagram, hypotheses, controls and higher-order constructs |
| 4. Measurement | Are the measures sufficiently reliable and valid? | Loadings or weights, reliability, AVE, HTMT, VIF |
| 5. Structural assessment | What are the magnitude and uncertainty of relationships? | β, bootstrap CIs, f² and adjusted R² |
| 6. Prediction and robustness | Do conclusions generalize and remain stable? | PLSpredict, CVPAT, alternative specifications and endogeneity |
2. Document methods before inspecting result tables
Write methods before selecting favorable results. Preserve a record of data, model, software and settings versions to prevent measurement, bootstrap and prediction tables from describing different models.
Justify PLS-SEM through objectives and model characteristics. Small or skewed samples do not automatically require it. Justify sample size with power or an appropriate inverse-square-root approach rather than the 10-times rule alone (Kock & Hadaya, 2018).
Causal language must match the design. Cross-sectional convenience samples generally support conditional-association interpretations. Endogeneity checks identify certain biases but do not turn observation into experimentation (Hult et al., 2018).
| Category | Information to preserve | Example record |
|---|---|---|
| Data | Original and analysis files, exclusions and missing codes | data_raw_01; data_analysis_03; cleaning log |
| Model | Diagram version, hypotheses, controls and indicators | model_v04; dated and justified changes |
| Software | SmartPLS version and operating system | SmartPLS 4.x; Windows |
| Algorithm | Weighting, iterations, stop criterion | Record actual values from the settings dialog |
| Inference | Bootstrap count, seed, CI and one-/two-sided test | 10,000 subsamples; fixed seed; percentile CI |
| Prediction | Folds, repetitions, seed, loss and benchmark | 10 folds; RMSE; LM benchmark |
- Prespecify explanatory, predictive or combined objectives.
- Justify construct types and measurement directions theoretically.
- Justify sample size using power or an appropriate method.
- Log every data and model change.
- Preserve software versions and settings in text or screenshots.
3. Report measurement according to construct type
For reflective models, report outer loadings and CIs, internal consistency reliability, AVE and discriminant validity. HTMT detects a lack of discriminant validity better than Fornell-Larcker under many simulated conditions (Henseler et al., 2015). Cutoffs are reference points; retention decisions also require construct content and uncertainty.
For composites or formative models, prioritize content coverage, indicator collinearity, outer weights and CIs. Loadings can inform absolute contributions when weights are nonsignificant. Do not remove an indicator solely for a small weight if this narrows the conceptual domain (Benitez et al., 2020).
Draw a separate conclusion for each construct. A blanket statement that measurement is acceptable conceals problematic constructs and the evidence used.
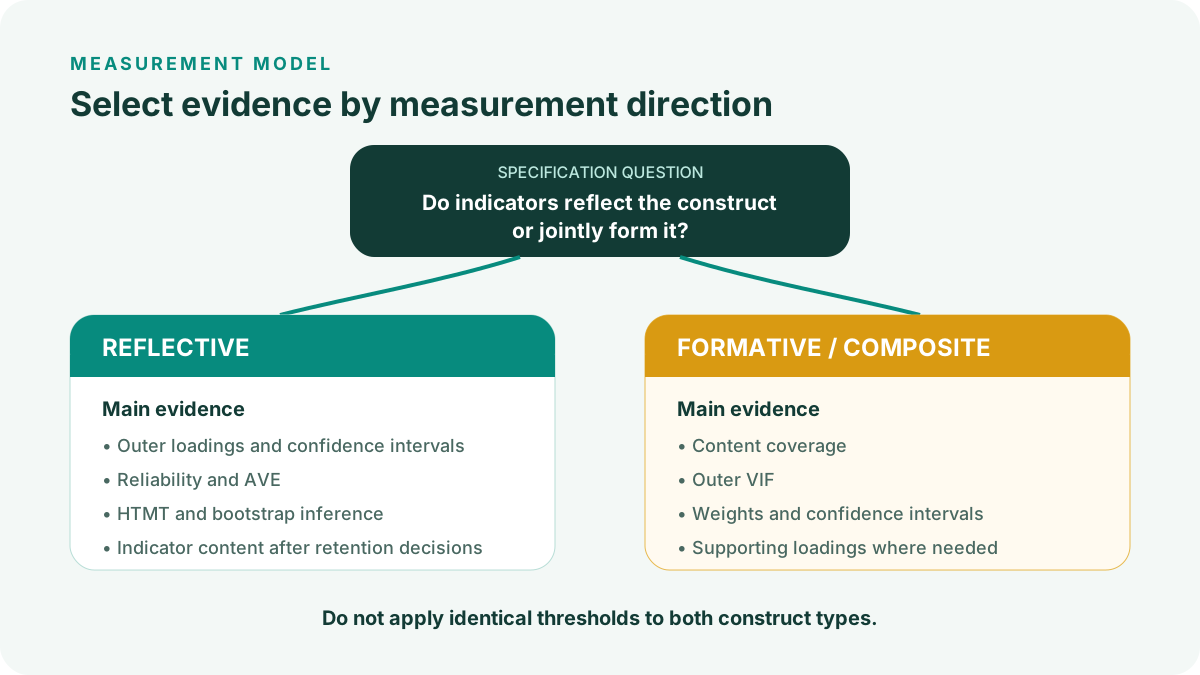
| Type | Main reporting | Substantive question |
|---|---|---|
| Reflective | Loadings and CIs; alpha, rho_A or CR; AVE; HTMT and CIs where appropriate | Are indicators interchangeable manifestations of the same construct? |
| Formative/composite | Outer VIF; weights and CIs; supplementary loadings; content coverage | Which part of the conceptual domain does each indicator contribute? |
| Higher-order | Estimation approach, measurement relationships at each level and level-specific tables | Is the higher-order construct theoretically meaningful or merely a model simplification? |
No single cutoff decides measurement quality. Report values, CIs, item content and the consequences of retention decisions.
4. Read structural results in a controlled sequence
Inspect inner VIF before interpreting paths. Then report β, bootstrap CIs, p-values if included in the inferential plan, f², and R² or adjusted R² for every endogenous variable. Coefficients describe conditional direction and magnitude; f² describes explanatory changes when a predictor is removed; R² describes in-sample explanation.
Mediation, moderation, multigroup and higher-order analyses need their own procedures. Report indirect effects and CIs rather than inferring mediation from two component p-values. For moderation, explain interaction construction, any standardization, and simple slopes or predictions at meaningful levels.
Mark changes made after inspecting results as post hoc. Explain added paths, removed indicators or altered controls and assess sensitivity against the original specification.
| Result | Question answered | Cannot directly establish |
|---|---|---|
| β and CI | Conditional direction, magnitude and uncertainty | Causality |
| p-value | Compatibility with the null under the testing model | Practical importance |
| f² | Individual explanatory contribution in this specification | Out-of-sample predictive ability |
| Adjusted R² | Adjusted in-sample explained variance | Generalization to new data |
Fix the model to be reported
Confirm data, indicators, paths, controls and model version. Save the diagram before estimation.
Inspect inner VIF
Check collinearity in each endogenous equation. Revisit content and specification before deleting variables.
Run the PLS-SEM Algorithm
Record β, R² and adjusted R². Check coefficient signs against coding and hypotheses.
Run bootstrapping
Use a fixed seed for reproducibility. SmartPLS currently recommends 10,000 subsamples for final results; state CI type and test direction (SmartPLS, n.d.-a).
Combine uncertainty with magnitude
Present β and CIs alongside f². A small p-value does not make an effect large.
Analyze advanced effects
Report indirect effects, interactions, group differences or higher-order relationships with their specific settings.
Maintain a decision log
Date and theoretically justify every post hoc change, including sensitivity results.
5. Make bootstrapping reproducible
Bootstrap results depend on settings and random seed. Stating that bootstrapping was performed is insufficient to reproduce CIs. Report subsamples, seed, sign-change settings, interval type and test direction.
SmartPLS defaults to percentile CIs and offers bias-corrected and accelerated CIs. Keep the choice consistent with the analysis plan rather than changing it after seeing results (SmartPLS, n.d.-a).
A one-sided test requires a theoretically justified directional hypothesis stated beforehand. Two-sided testing is more transparent for nondirectional hypotheses or effects that may go either way.
| Field | Value to enter | Reason |
|---|---|---|
| Subsamples | [10,000 or the number used] | Bootstrap-distribution stability |
| Random seed | [fixed value] | Reproducing the same results |
| Confidence interval | [percentile/BCa; 95%] | Defines inference |
| Tails | [one-tailed/two-tailed] | Matches hypothesis direction |
| Sign changes | [setting used] | Explains sign handling across resamples |
| Version | [SmartPLS x.x.x] | Tracks algorithm and interface changes |
6. Assess prediction and robustness
PLSpredict uses k-fold cross-validation and compares PLS-SEM errors against benchmarks. SmartPLS defaults to 10 folds, but each fold must contain enough observations for estimation. Report folds, repetitions, seed, error measure and benchmark (SmartPLS, n.d.-b; Shmueli et al., 2019).
CVPAT tests cross-validated loss differences between PLS-SEM and a benchmark or two models. Inspect the difference’s sign and magnitude before its p-value. A significant result favoring higher loss does not support the model (Liengaard et al., 2021).
Robustness checks should address plausible threats: alternative specifications, controls, endogeneity, heterogeneity, missing-data treatment or error metrics. State what changed and whether the main conclusion changed (Hult et al., 2018).
| Check | Hypothetical result | Limited conclusion |
|---|---|---|
| PLSpredict | RMSE PLS = .720; RMSE LM = .760 | Lower PLS than LM error for this indicator |
| CVPAT | Loss PLS - LM = -.014; p = .031 | Lower PLS loss under the specified direction |
| Additional control | Main β changes from .284 to .269 | Direction and magnitude are relatively stable here |
| Alternative specification | Indirect-effect CI includes 0 | Mediation conclusion is not robust to the alternative specification |
All table values illustrate reporting only. They are not empirical results or reference thresholds.
7. Package tables, figures and files for verification
Give each table a purpose. Do not mix reflective measurement results with formative weights. Structural tables should align β, CIs, f² and hypothesis decisions in a consistent order. Prediction tables must identify the indicator, loss, benchmark and cross-validation settings.
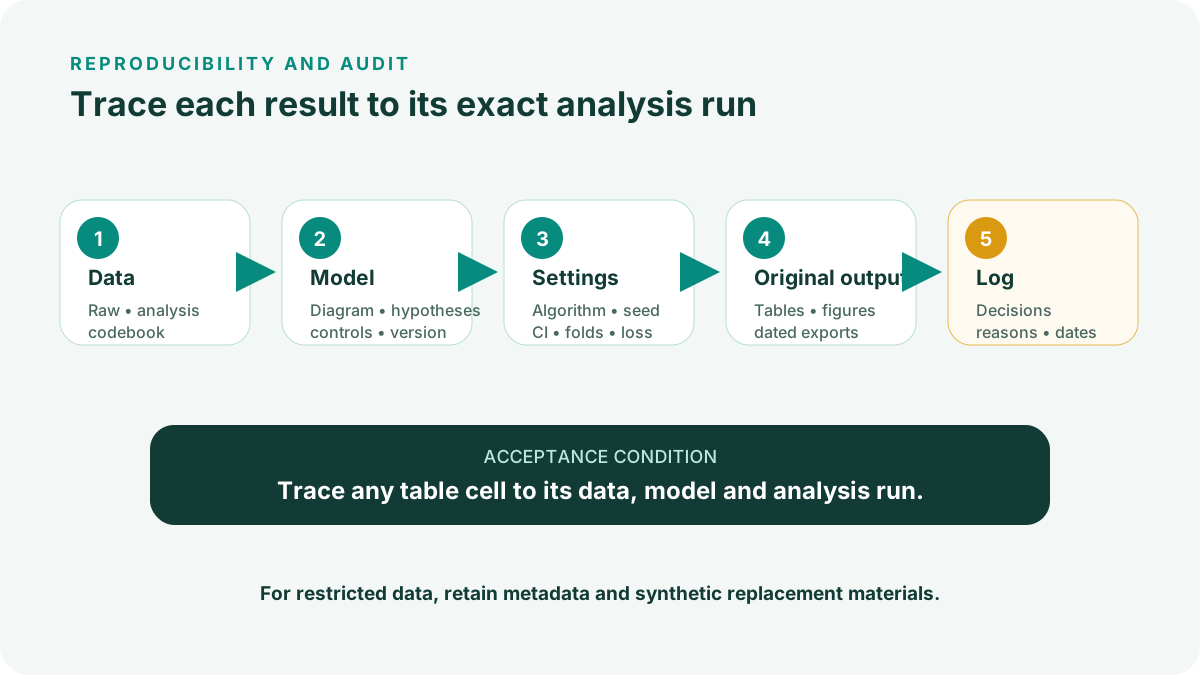
A minimal reproducibility package includes analysis data or substitute metadata, a codebook, model files, settings records, original output and a decision log. If confidentiality restricts data, preserve a synthetic-data generation procedure or enough descriptive material to inspect the analytical logic.
Use versioned filenames and do not overwrite originals. Include a table in a manuscript only when it can be traced to the correct data, model and run.
- Use consistent rounding in tables and text.
- Keep construct and indicator names consistent across diagrams, output and manuscript.
- Give figures captions, alt text and software versions where relevant.
- Preserve original data and version the analysis files.
- Include a codebook and cleaning log.
- Include model files and algorithm-setting screenshots.
- Preserve original Algorithm, bootstrap and PLSpredict/CVPAT output.
- Clearly identify post hoc changes.
8. APA 7 reporting template and submission checklist
Use this as a fill-in framework. Retain only procedures actually performed and replace every bracket with study information.
Reporting example in English
PLS-SEM was selected because [objectives and construct types]. Analyses used SmartPLS [version] with [algorithm settings]. Sample size was justified using [power/method], N = [ ]. Reflective measurement was assessed using [loadings, reliability, AVE and HTMT]; formative constructs used [outer VIF, weights and CIs]. Bootstrapping used [number] subsamples, fixed seed [ ], [type; level] confidence intervals and [one-/two-sided] tests. Structural results included β, CIs, f², R² and adjusted R². Out-of-sample assessment used PLSpredict with [folds, repetitions, loss, benchmark] and CVPAT [if used]. Robustness checks included [ ]; conclusions were [stable/changed] under [conditions].
- Do not justify the method solely by small samples or skewed data.
- Do not justify sample size solely by the 10-times rule.
- Describe sampling, missingness, outliers and all exclusions.
- Distinguish reflective, formative and higher-order constructs.
- Report the SmartPLS version, Algorithm settings and bootstrap settings.
- Report β, CIs, f², R² and adjusted R² for each endogenous variable.
- Assess out-of-sample prediction using PLSpredict and CVPAT when appropriate.
- Identify benchmarks, folds, repetitions, seeds and loss functions.
- Disclose post hoc analyses and unfavorable findings.
- Keep causal language within the design’s limits.
- Match in-text citations and references in both directions.
- Make manuscript tables traceable to original runs.
Conclusion
A trustworthy PLS-SEM report is a traceable chain of decisions. Readers should see why the model was chosen, how measurement was assessed, which settings support inference, and whether conclusions survive held-out data or plausible alternative specifications.
References
- Benitez, J., Henseler, J., Castillo, A., & Schuberth, F. (2020). How to perform and report an impactful analysis using partial least squares: Guidelines for confirmatory and explanatory IS research. Information & Management, 57(2), 103168.https://doi.org/10.1016/j.im.2019.05.003
- Hair, J. F., Risher, J. J., Sarstedt, M., & Ringle, C. M. (2019). When to use and how to report the results of PLS-SEM. European Business Review, 31(1), 2-24.https://doi.org/10.1108/EBR-11-2018-0203
- Henseler, J., Ringle, C. M., & Sarstedt, M. (2015). A new criterion for assessing discriminant validity in variance-based structural equation modeling. Journal of the Academy of Marketing Science, 43, 115-135.https://doi.org/10.1007/s11747-014-0403-8
- Hult, G. T. M., Hair, J. F., Proksch, D., Sarstedt, M., Pinkwart, A., & Ringle, C. M. (2018). Addressing endogeneity in international marketing applications of partial least squares structural equation modeling. Journal of International Marketing, 26(3), 1-21.https://doi.org/10.1509/jim.17.0151
- Kock, N., & Hadaya, P. (2018). Minimum sample size estimation in PLS-SEM: The inverse square root and gamma-exponential methods. Information Systems Journal, 28(1), 227-261.https://doi.org/10.1111/isj.12131
- Liengaard, B. D., Sharma, P. N., Hult, G. T. M., Jensen, M. B., Sarstedt, M., Hair, J. F., & Ringle, C. M. (2021). Prediction: Coveted, yet forsaken? Introducing a cross-validated predictive ability test in partial least squares path modeling. Decision Sciences, 52(2), 362-392.https://doi.org/10.1111/deci.12445
- Shmueli, G., Sarstedt, M., Hair, J. F., Cheah, J.-H., Ting, H., Vaithilingam, S., & Ringle, C. M. (2019). Predictive model assessment in PLS-SEM: Guidelines for using PLSpredict. European Journal of Marketing, 53(11), 2322-2347.https://doi.org/10.1108/EJM-02-2019-0189
- SmartPLS. (n.d.-a). Bootstrapping.https://smartpls.com/documentation/algorithms-and-techniques/resampling-and-inference/bootstrapping/
- SmartPLS. (n.d.-b). PLSpredict.https://smartpls.com/documentation/algorithms-and-techniques/prediction-and-segmentation/predict/
Methodological note: The slug retains 2022 from the earlier URL. Content was updated using methodological sources and current SmartPLS documentation through 30/10/2026.